Introduction to Plotly Dashboard and Dash
Plotly is a powerful library that specializes in creating interactive data visualizations and dashboard. It is renowned for its rich set of features that accommodate various types of plots, making it a go-to option for developers and data analysts. Unlike traditional static graphs, Plotly dashboards allow users to engage with data dynamically and intuitively. This library supports multiple programming languages, with Python being one of the most favored options. Through Plotly in Python, users can craft intricate data representations and share insights with an array of audiences. Moreover, the integration of Plotly graph objects makes it simpler to customize and enrich the visual elements of your data, promoting a clearer understanding of the presented information.
On the other hand, Dash serves as an effective framework designed to build web applications featuring Plotly graphs. It allows for the creation of intricate dashboards that can include multiple interactive components, giving users a unified interface to work with their data. Dash simplifies the process of combining specific Plotly examples into robust applications, seamlessly integrating user inputs and real-time data updates. By utilizing dash components, developers can create more sophisticated dashboards equipped with dropdowns, sliders, and graphs, which enhance the user experience and data exploration process.
Together, Plotly and Dash represent a significant stride in data visualization technology. Users benefit from the flexibility and ease of crafting engaging web applications that present data in an easily digestible format. Whether you’re leveraging Plotly in Python or R, the accessibility these tools provide empowers a wide range of users, from beginners to advanced data scientists. Thus, understanding how to utilize Plotly’s sophisticated capabilities alongside Dash’s framework is essential to enhancing data analysis and reporting in a modern context.
Why Use Plotly for Dashboards?
- Interactive visualizations with hover tools, zooming, and panning
- Wide range of chart types (line, bar, scatter, pie, heatmaps, etc.)
- Easy integration with Python data science stack (Pandas, NumPy)
- Beautiful, publication-quality graphics
- Open-source with both Python and R support
Setting Up Your Environment
Creating interactive dashboards with Plotly in Python begins with an appropriate setup of your development environment. First, you need to install the necessary libraries that facilitate the building of these visualizations. Plotly, a prominent choice for creating interactive plots, is essential for implementing the dashboard features you desire. Additionally, Dash, developed by Plotly, serves as a powerful framework to create web applications that display Plotly graphs effectively.
To get started, consider using Anaconda, which is a popular distribution for data science that simplifies the management of libraries and environments. After installing Anaconda, you can create a new environment tailored for your project by using the Anaconda Navigator or executing the command line interface. Use the following command: conda create -n plotly_dashboard python=3.8. This creates a dedicated environment named ‘plotly_dashboard’ with Python 3.8, ensuring compatibility with the latest Plotly library.
Once the environment is established, activate it by running conda activate plotly_dashboard. At this juncture, the next step is to install the required packages. If you are inclined toward using pip, you may install Plotly and Dash by executing the command: pip install plotly dash. Alternatively, if you opt for Anaconda, you can use conda install -c plotly plotly dash to fetch the libraries from Plotly’s channel.
After completing these installations, it is prudent to validate that your libraries are correctly installed. This can be accomplished by opening a Python interactive shell or Jupyter Notebook and typing the following:
import plotlyimport dash
Before we begin, you’ll need to install the necessary packages:
pip install dash plotly pandasFor more advanced features, you might also want:
pip install dash-bootstrap-components dash-core-components dash-html-components dash-tableIf no errors arise, you are poised to begin designing your dashboards with Plotly graph objects and exploring various Plotly dashboard examples. With the environment prepared, you will be equipped to harness the full potential of Plotly in Python and create effective interactive dashboards.
Need Help in Programming?
I provide freelance expertise in data analysis, machine learning, deep learning, LLMs, regression models, NLP, and numerical methods using Python, R Studio, MATLAB, SQL, Tableau, or Power BI. Feel free to contact me for collaboration or assistance!
Follow on Social

Creating Your First Dashboard in Plotly
Creating an interactive dashboard using Plotly in Python is an engaging and intuitive process. To begin the journey, first ensure you have installed the necessary libraries, namely Plotly and Dash. These libraries provide robust support for building dynamic dashboards. You can install both libraries using pip by executing the following command in your terminal: pip install plotly dash.
Once installed, you can start by importing the required modules in your Python script. Below is a simple code snippet to get started:
import dashfrom dash import dcc, htmlimport plotly.express as pximport pandas as pdIn this example, we will use a dataset available in the Plotly library itself. For demonstration purpose, let’s use the famous Iris dataset. This dataset includes measurements of various flowers, and we will plot the sepal and petal lengths:
df = px.data.iris()Next, create a simple layout for your dashboard using Dash. The layout should contain a graph component where the Plotly graph will be rendered:
app = dash.Dash(__name__)app.layout = html.Div([ dcc.Graph(id='iris-graph'),])To build interactivity, we can implement callbacks that respond to user inputs. Define a callback function to create a Plotly graph object:
@app.callback( dash.dependencies.Output('iris-graph', 'figure'), [])def update_graph(): fig = px.scatter(df, x='sepal_length', y='sepal_width', color='species') return figFinally, run the Dash app by including the following line:
if __name__ == '__main__': app.run_server(debug=True)As you execute the code, your browser will open a window displaying the dashboard. This simple Plotly dashboard demonstrates how straightforward it is to create interactive visualizations with Plotly in Python. By exploring various Plotly dashboard examples, you can easily expand your knowledge and enhance the dashboard’s functionality using plotly subplots or additional interactivity. Creating interactive dashboards offers a practical, hands-on approach to data visualization.
Let’s start with a simple dashboard containing a single interactive plot.
import dash
import dash_core_components as dcc
import dash_html_components as html
import plotly.express as px
import pandas as pd

# Sample data
df = pd.DataFrame({
    "Fruit": ["Apples", "Oranges", "Bananas", "Apples", "Oranges", "Bananas"],
    "Amount": [4, 1, 2, 2, 4, 5],
    "City": ["SF", "SF", "SF", "NY", "NY", "NY"]
})

# Create the Dash app
app = dash.Dash(__name__)

# Create the figure using Plotly Express
fig = px.bar(df, x="Fruit", y="Amount", color="City", barmode="group")

# Define the app layout
app.layout = html.Div(children=[
    html.H1(children='Fruit Consumption Dashboard'),

    html.Div(children='''
        A simple example of an interactive Plotly dashboard.
    '''),

    dcc.Graph(
        id='example-graph',
        figure=fig
    )
])

if __name__ == '__main__':
    app.run_server(debug=True)
This code creates a basic dashboard with a grouped bar chart showing fruit consumption in different cities. Run the script and navigate to http://127.0.0.1:8050/ in your browser to see the dashboard.
Advanced Dashboard Features with Plotly
In the realm of data visualization, creating a compelling Plotly dashboard entails incorporating advanced features that facilitate user interaction and enhance data insights. One of the most valuable additions is filtering data. By implementing filtering options, users can customize their view and focus on specific datasets that matter most to them. This not only improves the user experience but also allows for targeted analysis of the information presented.
Another essential feature to include is the use of dropdown menus. Dropdowns enable users to select from various categories or ranges, dynamically updating the Plotly graphs in the dashboard based on their choices. This approach is particularly effective when analyzing extensive datasets where users may wish to drill down into subsets of the data. To create a dropdown in Plotly in Python or Plotly in R, utilize the Plotly library’s built-in components to bind the dropdown selections to specific data visualizations.
Moreover, sliders provide another layer of interactivity. Sliders allow users to adjust values in real-time, which can be particularly beneficial for visualizing trends over time or varying parameters within datasets. By incorporating Plotly subplots, one can present multiple visualizations in a single interface, updating simultaneously as slider values change, thereby offering comprehensive insights at a glance.
Lastly, integrating interactive maps within a Plotly dashboard enables users to explore geographical data through intuitive visual representations. This is vital for applications in fields such as logistics and marketing, where location-based insights are crucial. To achieve this, one can utilize the Plotly library to embed interactive maps that respond to user inputs like clicks or hovers.
Now let’s create a more sophisticated dashboard with multiple plots and interactive controls using Plotly Graph Objects and subplots.
import dash
from dash import dcc, html, Input, Output
import plotly.graph_objects as go
from plotly.subplots import make_subplots
import pandas as pd
import numpy as np

# Generate sample data
np.random.seed(42)
dates = pd.date_range(start='2023-01-01', end='2023-12-31')
df = pd.DataFrame({
    'Date': dates,
    'Value': np.random.randn(len(dates)).cumsum(),
    'Category': np.random.choice(['A', 'B', 'C'], len(dates))
})

# Initialize the Dash app
app = dash.Dash(__name__)

app.layout = html.Div([
    html.H1("Advanced Financial Dashboard"),

    html.Div([
        dcc.Dropdown(
            id='category-selector',
            options=[{'label': cat, 'value': cat} for cat in df['Category'].unique()],
            value=['A', 'B', 'C'],
            multi=True
        ),
        dcc.DatePickerRange(
            id='date-range',
            min_date_allowed=df['Date'].min(),
            max_date_allowed=df['Date'].max(),
            start_date=df['Date'].min(),
            end_date=df['Date'].max()
        ),
    ], style={'width': '100%', 'display': 'inline-block'}),

    dcc.Graph(id='main-graph'),

    html.Div([
        dcc.Graph(id='pie-chart'),
        dcc.Graph(id='histogram')
    ], style={'display': 'flex', 'flex-direction': 'row'})
])

@app.callback(
    Output('main-graph', 'figure'),
    Output('pie-chart', 'figure'),
    Output('histogram', 'figure'),
    Input('category-selector', 'value'),
    Input('date-range', 'start_date'),
    Input('date-range', 'end_date')
)
def update_graphs(selected_categories, start_date, end_date):
    # Filter data based on selections
    filtered_df = df[
        (df['Category'].isin(selected_categories)) &
        (df['Date'] >= start_date) &
        (df['Date'] <= end_date)
    ]

    # Create main time series plot with subplots
    fig = make_subplots(specs=[[{"secondary_y": True}]])

    for category in selected_categories:
        category_df = filtered_df[filtered_df['Category'] == category]
        fig.add_trace(
            go.Scatter(
                x=category_df['Date'],
                y=category_df['Value'],
                name=category,
                mode='lines+markers'
            ),
            secondary_y=False
        )

    # Add some styling
    fig.update_layout(
        title='Time Series with Range Selector',
        xaxis_title='Date',
        yaxis_title='Value',
        hovermode='x unified'
    )

    # Create pie chart
    pie_fig = go.Figure()
    pie_fig.add_trace(go.Pie(
        labels=filtered_df['Category'],
        values=filtered_df['Value'].abs(),
        hole=.3
    ))
    pie_fig.update_layout(title='Category Distribution')

    # Create histogram
    hist_fig = go.Figure()
    hist_fig.add_trace(go.Histogram(
        x=filtered_df['Value'],
        nbinsx=20
    ))
    hist_fig.update_layout(title='Value Distribution')

    return fig, pie_fig, hist_fig

if __name__ == '__main__':
    app.run_server(debug=True)
This advanced dashboard includes:
- A time series plot with interactive controls
- A category distribution pie chart
- A value distribution histogram
- Date range picker and category selector dropdowns
- Responsive layout that updates all components when filters change
Incorporating these advanced features into your dashboard not only enriches the user interaction but also enhances the overall analytical capacity of the displayed information, making them invaluable tools for data-driven decision-making.
Learn Python for Data Analysis Assignment
This guide offers a thorough introduction to Python, presenting a comprehensive guide tailored for beginners who are eager to embark on their journey of learning Python from the ground up.

Deploying Your Plotly Dashboard
Once you've created your dashboard, you'll want to share it with others. Here are several deployment options:
1. Plotly's Dash Enterprise
The simplest option is to use Plotly's commercial Dash Enterprise platform.
2. Heroku
Heroku offers a free tier suitable for small dashboards:
- Create a
Procfilewith:web: gunicorn app:server - Create a
requirements.txtwith all dependencies - Push to Heroku using Git
3. PythonAnywhere
PythonAnywhere provides an easy way to host Python web apps:
# Install dependencies
pip install dash plotly pandas gunicorn

# Configure your web app through their web interface
4. Docker
For more control, you can containerize your app:
# Dockerfile example
FROM python:3.9-slim

WORKDIR /app
COPY . .

RUN pip install -r requirements.txt

EXPOSE 8050

CMD ["gunicorn", "--bind", "0.0.0.0:8050", "app:server"]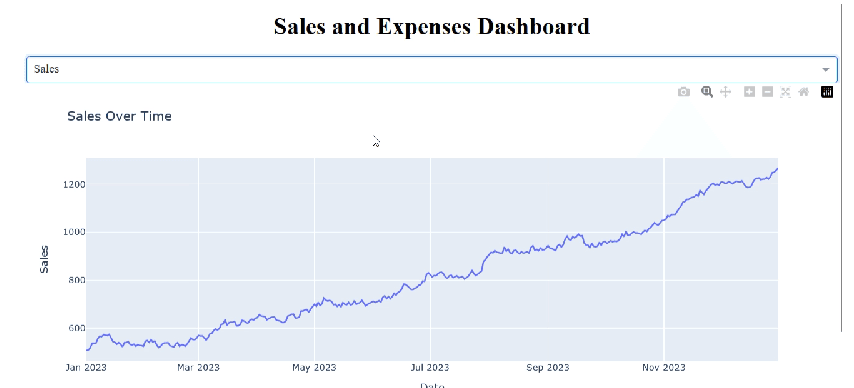
Integrating Data for Analysis and Reporting
Integrating various data sources into a Plotly dashboard is essential for effective data analysis and reporting. Plotly in Python offers flexibility in incorporating different types of data, such as CSV files, databases, and APIs, allowing users to create comprehensive visualizations that reflect current trends and insights.
One common method to begin with is importing data from CSV files. Utilizing the Pandas library, one can easily read CSV files into DataFrames, which can then be manipulated for the desired visual representation. For example, the function pd.read_csv('file_path.csv') allows users to load their data with ease. Once the data resides within a DataFrame, various methods can enhance its usability, such as filtering, grouping, or pivoting the data to prepare it for visualization. This preparatory step is crucial when creating Plotly graph objects, as it allows for cleaner and more informative dashboards.
For those looking to integrate larger data scenarios, databases are often the go-to solution. Plotly in R and Python supports connectivity to several databases, including SQL and NoSQL options, enabling users to execute queries and retrieve data directly into their dashboards. Implementing SQLAlchemy or similar libraries allows you to seamlessly connect and execute queries, which can import the result sets directly into a DataFrame for visualization.
APIs also serve as an important data source. By leveraging libraries such as requests in Python, users can retrieve data from web services. This method of integration is particularly useful for pulling real-time data into dashboards. The process involves sending a request to the API endpoint, parsing the returned data, and transforming it into a usable format for Plotly visualizations.
To summarize, whether utilizing CSV files, accessing databases, or fetching data through APIs, understanding how to integrate data source types effectively is central to harnessing the potential of a Plotly dashboard for robust data analysis and reporting.
Example Plotly Dashboard for Data Analysis
When it comes to data analysis and reporting, leveraging a Plotly dashboard can transform raw data into interactive visual insights. Below are several Plotly dashboard examples that illustrate the diverse applications of this powerful tool in different contexts.
One notable example is a sales performance dashboard designed for businesses looking to evaluate their monthly sales figures. Utilizing various Plotly graph objects, this dashboard includes line charts to depict sales trends over time, bar charts for product category comparisons, and pie charts to illustrate market share distribution among different products. By employing plotly subplots, users can view multiple perspectives on data simultaneously, making it easier to draw conclusions swiftly.
Another effective Plotly dashboard is dedicated to user engagement analytics for websites or applications. This dashboard typically features heatmaps to visualize user activity across different sections of the site and scatter plots to identify correlations between page visits and conversion rates. By integrating Plotly in Python or Plotly in R, analysts can tailor these visualizations to suit specific metrics of interest, allowing for comprehensive monitoring of user behavior over time.
For educational purposes, dashboards that track student performance present a more nuanced example. These dashboards often include histograms to analyze test score distributions, along with box plots to highlight outliers among student performance levels. The effective use of plotly subplots again allows educators to convey comprehensive insights regarding student data, fostering better educational strategies.
Ultimately, the adaptability of a Plotly dashboard makes it an invaluable resource for professionals across various industries. These Plotly dashboard examples showcase the potential of dynamic visualization in turning complex data into actionable knowledge, thus empowering informed decision-making.
Best Practices for Dashboard Design
Creating an effective plotly dashboard involves adhering to several best practices that enhance both the functionality and user experience. The first step is to choose the right type of visualizations. Different datasets may require distinct visual representation methods. For instance, when dealing with time series data, a line chart may be more appropriate, while categorical data could be best represented through bar charts. Utilizing plotly graph objects enables users to customize almost every aspect of the visual, ensuring that each graph conveys its intended message clearly.
Clarity is paramount in dashboard design. Users must be able to understand the data at a glance. This can be achieved by avoiding excessive clutter, selecting appropriate colors, and ensuring that text and graphical elements are readable. For example, integrating plotly subplots can help in comparing multiple datasets side-by-side, without overwhelming the viewer. Each element in the dashboard should serve a purpose and contribute to the overall narrative of the data being presented.
User experience principles are equally important in creating impactful dashboards. The design should guide users through the information logically and intuitively. Providing interactivity, such as tooltips and drop-down menus when using plotly in Python or plotly in R, can greatly improve engagement, allowing users to delve deeper into the data without detracting from the main insights. This efficiency can make a significant difference in how the information is perceived and utilized.
Finally, consider the layout of your dashboard. A well-organized structure can lead to a smoother navigation experience. Group related visualizations together; for instance, place summary metrics at the top, followed by detailed charts and analysis. In conclusion, adhering to these best practices ensures that your plotly dashboard not only looks appealing but also serves its intended purpose effectively.
Deployment Options for Plotly Dashboard
Deploying a Plotly dashboard effectively is crucial to ensure that it is accessible to users in diverse environments. There are several deployment options available, including using Flask, Heroku, or even incorporating it in cloud services such as AWS and Google Cloud. Each option has its unique advantages and considerations that can influence the choice based on specific requirements.
One common method for deploying a Plotly dashboard is through a Flask application. Flask serves as a lightweight web framework that allows the integration of Plotly graph objects seamlessly into web applications. By wrapping the Plotly dashboards in Flask routes, developers can serve visuals directly in their web applications. For this method, it is essential to set up a basic Flask environment and configure routing for the dashboard, which can be achieved through a few straightforward steps.
Alternatively, deploying on Heroku offers a cloud platform option favorable for beginners and those looking for a straightforward deployment method. Heroku provides an easy interface to push your Flask app for hosting, allowing for both free and paid tiers depending on usage needs. The deployment process typically involves adding a configuration file (Procfile) and ensuring that your application dependencies are properly documented in a requirements.txt file. This method is ideal for those working with Plotly in Python, as it streamlines the publishing process without intricate server management.
Other options, like deploying on virtual machines or containers such as Docker, provide flexibility in managing resources and scaling applications as needed. However, these methods can require additional technical expertise. When choosing a deployment solution for your Plotly dashboard, evaluating factors such as ease of use, scalability, and the target audience is essential to make an informed decision. The variety of deployment options indeed empowers developers to share their interactive dashboards widely with the intended audience.
Troubleshooting Common Issues
When creating a Plotly dashboard, developers may encounter a variety of challenges that could hinder the smooth deployment of their visual projects. Understanding common issues and their solutions is crucial to ensuring effective use of Plotly in Python or R. Below are some frequent problems along with practical solutions.
One common issue is the failure to load data properly within the dashboard. This might occur due to incorrect file paths or incompatible data formats. It is recommended to verify that the data location is correctly specified and that the format, whether it's CSV, JSON, or others, is compatible with the Plotly platform. Additionally, ensuring that the data is clean and free of inconsistencies can prevent unexpected behavior in the generated Plotly graph objects.
An equally common hurdle arises when visualizations take an excessively long time to render. This can be particularly troublesome with complex visualizations or when using multiple Plotly subplots. To address this, optimizing the data being visualized by reducing its size or simplifying the visualizations can prove beneficial. Utilizing aggregations or sampling techniques prior to plotting can significantly improve performance.
Another issue involves responsiveness in the dashboard interface. Users may find that their Plotly dashboard does not scale well across different screen sizes. To mitigate this, developers should employ CSS media queries or responsive layout designs. Additionally, updating the Plotly libraries to the latest version can resolve many glitches related to responsiveness.
Lastly, conflicts between different libraries can sometimes produce errors or cause visualizations not to display properly. To minimize this risk, it is advisable to check for compatibility issues among the libraries being used alongside Plotly. Aligning versions and ensuring all required dependencies are installed can alleviate many integration challenges.
Implementing these troubleshooting steps will empower developers to overcome the typical obstacles associated with creating interactive dashboards using Plotly, enhancing the overall user experience.
Conclusion and Future Learning Paths
The journey into creating interactive dashboards with Plotly in Python is both enriching and insightful. Throughout this blog post, we have explored the various capabilities of Plotly, including plotly graph objects and plotly subplots, showcasing how they can enhance visual storytelling through data. The ability to create dynamic and responsive data visualizations elevates the interpretative power of the data, making tools like a plotly dashboard invaluable for data analysts and developers alike.
In our discussion, we also highlighted different plotly dashboard examples, demonstrating the versatility of the library for a wide range of applications—from basic bar charts to more complex heatmaps and time series analysis. By integrating Plotly with Python, developers can leverage a powerful toolkit capable of transforming raw data into actionable insights, thus fostering data-driven decision-making.
As you grow more comfortable with the initial concepts, we encourage you to explore the advanced features Plotly offers. Diving deeper into the nuances of Plotly in Python and Plotly in R can unlock new potentials for your data visualizations. Additional resources are available, including official documentation, online courses, and community forums, which can serve as excellent platforms for continued learning. Engaging with these communities not only enhances your skills but also allows you to share knowledge with peers and gain insights from their experiences.
Ultimately, mastering the art of designing effective dashboards is an ongoing process. The more you practice utilizing plotly subplots and engaging with cutting-edge visualization techniques, the more proficient you will become. Plotly presents a wealth of opportunities for innovation and creativity in data visualization. Therefore, we strongly encourage you to pursue these paths as you further enhance your skills and capabilities in this dynamic field.