Self-built product
Meridian
A SaaS revenue dashboard that explains why recurring revenue moved, scores every customer’s churn risk, and tracks the plays to save them.
A complete product I designed, built and tested myself. Client work is in Case studies.
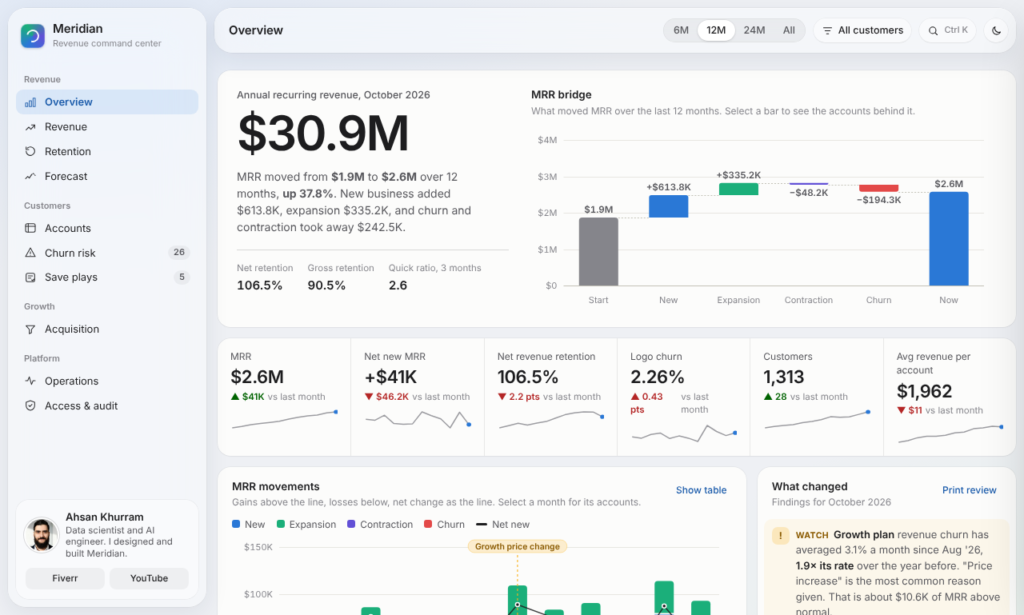
Revenue moved. Why, and who’s next?
A subscription business can see its monthly recurring revenue change, but not always why, or which customers are about to leave. By the time churn shows up in the totals, the chance to save those accounts has passed.
From the headline number to the accounts behind it
The MRR bridge splits growth into new business, expansion, contraction and churn, and every bar opens the accounts behind it. Retention, cohorts and KPIs come from the same data, so the numbers always match.
Every customer gets a churn score that shows why, plus a recommended save play with an owner and a due date, tracked to saved or lost. A 12-month revenue forecast is shown as a range, with scenarios.
Checks every segment against its own history
Each plan, region and channel is checked against its own history, and a real rise in churn is flagged with the reason customers gave. The churn scores are backtested on six months of past cancellations. Meridian loads a monthly MRR export and recalculates in the browser.
Tech stack
- JavaScript
It caught a price increase driving churn
Meridian caught a price increase that nearly doubled churn on one plan: 1.9 times the usual rate on the Growth plan.
Screens from Meridian
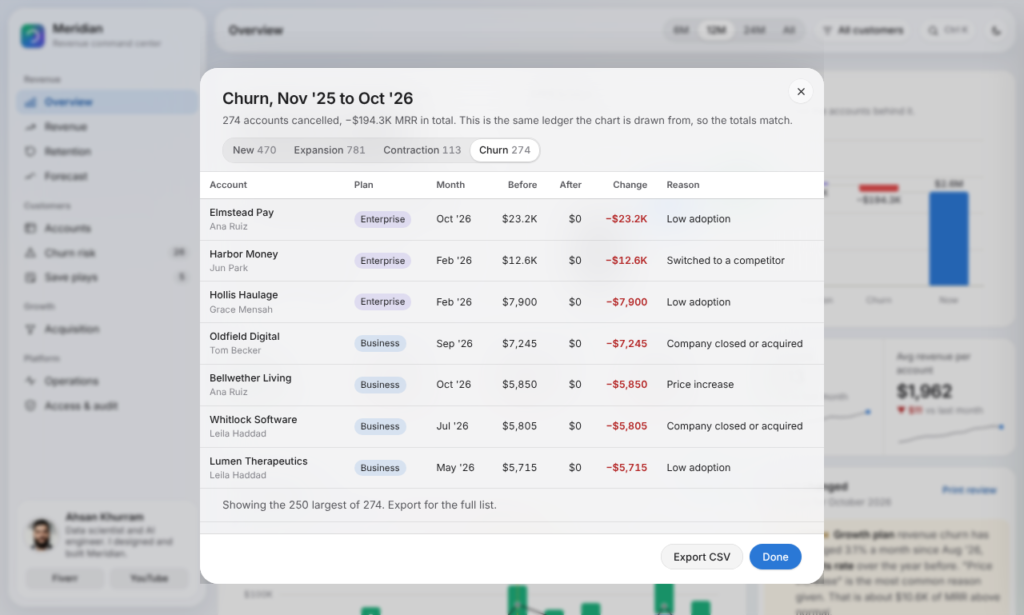
The accounts behind a churn bar, with the reasons given.
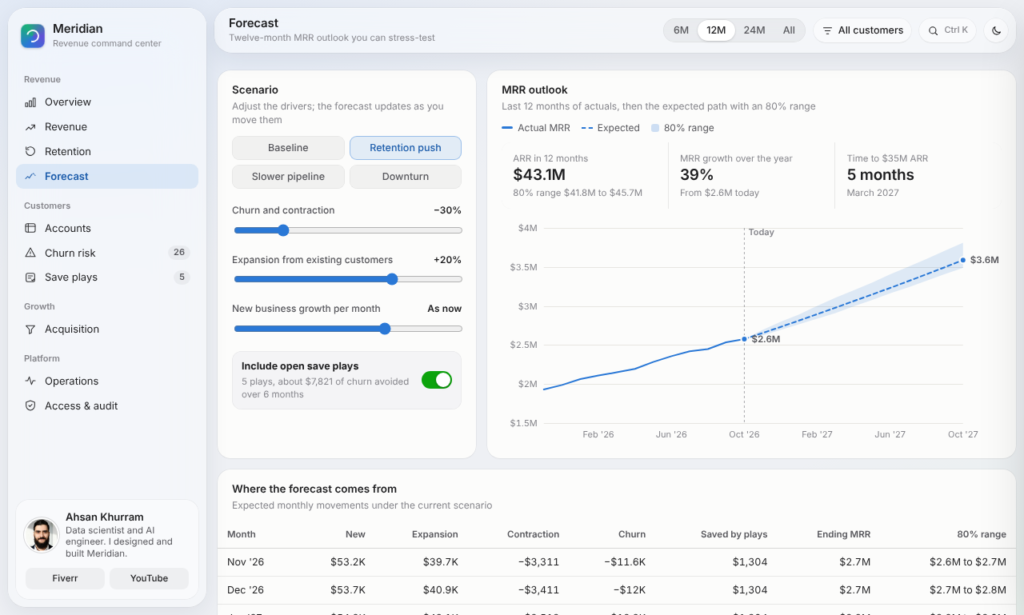
The 12-month forecast as a range, with scenarios.
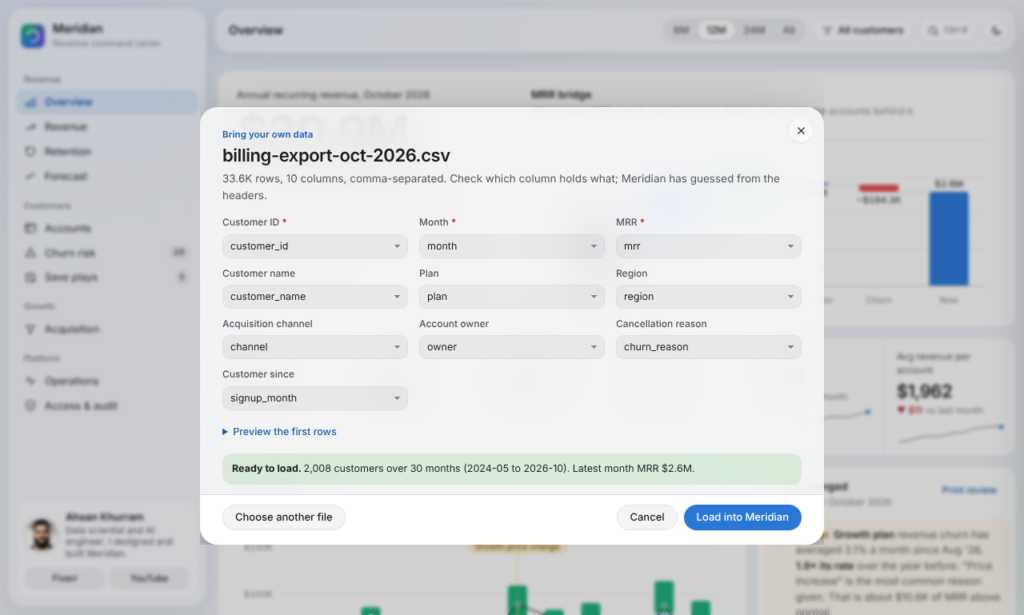
Loading a monthly MRR export.
Want something like this for your business?
Tell me what you need it to do. I’ll reply within 24 hours on weekdays with questions or a suggested first step.
Start with the $150 scoping session, credited toward the build.